| Documentation |
| Datasheet | data sheet.PDF |
| Application Note | Application Note |
Sharp GP2Y1014AU0F Dust Sensor Application Guide
Sharp GP2Y1014AU0F Dust Sensor Application Guide
Overview
GP2Y1014AU0F is one of the newer models in Sharp’s lineup of PM (particulate matter) dust sensors. Designed for use in home air purifiers, GP2Y1014AU0F is an analog output dust sensor which is similar to the popular GP2Y1010AU0F model but with improved accuracy. In terms of Arduino circuit and application source code, these two analog dust sensors are more or less interchangeable. You can usually find GP2Y1014AU0F in stock at various components distributors.
Besides air purifiers, GP2Y1014AU0F can also be found in smart home applications such as room monitors and portable air quality monitors. Renasys has a publicly available reference design for a battery-powered, PM2.5 air quality monitor based on GP2Y1014AU0F (search for PM2.5). You can download a complete project which includes circuit diagrams, BOM, and sample source code. EME Systems in California also uses GP2Y1014AU0F in a couple of their air quality projects.
How do Sharp dust sensors work?
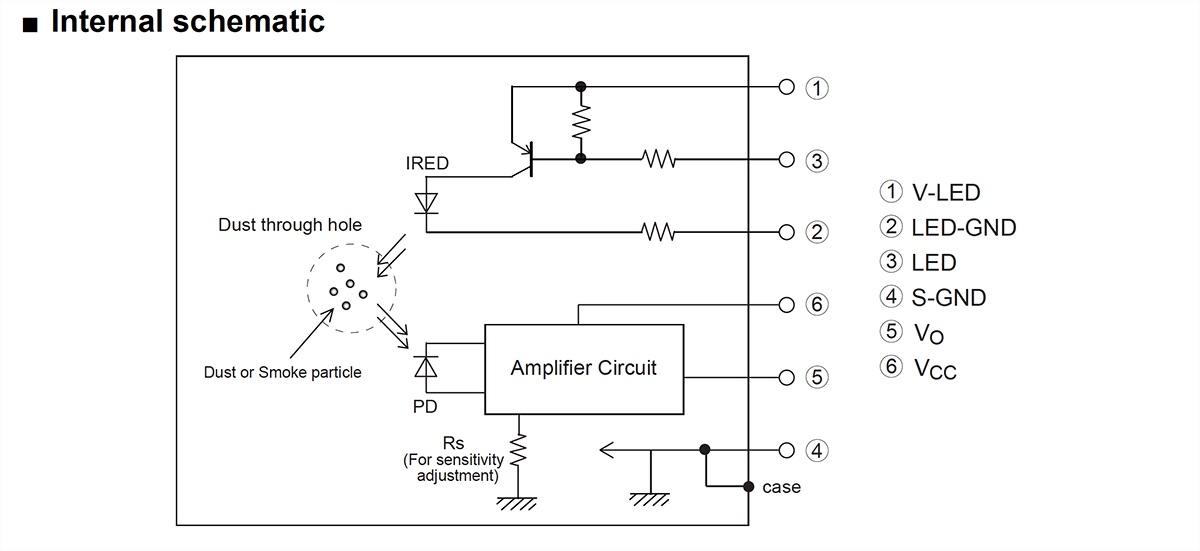
Sharp dust sensors operate on the principle of light scattering. A photo-detector and LED emitter oppose each other at an angle within the rectangular package of the sensor which has a dust through hole on either side. Air containing dust particles flows into the sensor chamber and causes the light from the LED emitter to be scattered towards the photo-detector. The more dust there is in the air within the sensor chamber, the greater the intensity of the scattered light. The dust sensor outputs a voltage value which varies according to the intensity of the scattered light which in turn corresponds to the level of dust in the air. The actual dust density (or dust or mass concentration) can then be calculated from the output voltage value using a linear relation.

Key concepts and terminology

Comparing GP2Y1010AU0F and GP2Y1014AU0F

Both dust sensor models measure the total dust density. This total includes the concentrations of 1 micron particles, 2.5 micron particles, 10 micron particles, etc. In practice though, when the total dust density/concentration reads very high, such as in the presence of cigarette smoke, most of the detected concentration is due to PM2.5 particles anyways (PM2.5 means particles with size < 2.5um). In addition, with these analog output models, there is the further possibility to analyze the output signals in order to distinguish between smoke particles and house dust.
You can find the detailed specifications for both dust sensor models here.
Airflow design considerations
The GP2Y1014AU0F dust sensor does not include any built-in fan to supply airflow to the sensor (and note that the specification does not indicate any airflow is required). This can be advantageous in terms of providing flexibility in sensor orientation and positioning. But still, it is a good idea to think about whether you need to design in at least some airflow into your application. Providing some airflow (from a fan, natural convection, or wind) will allow the sensor to react quicker to changes in dust concentration. For example, if your application is an air purifier or an air conditioner, you might be able to use the system’s natural airflow for this purpose. Other options include adding a mini 20x20mm or 25x25mm external fan but this will introduce additional design considerations such as fan reliability, noise, and cost. To summarize, while airflow is not strictly required, it can help the GP2Y1014AU0F sensor to react quicker to changes in dust concentration.
Sharp also advises to use a coarse mesh filter in your application design to prevent large dust particles from entering the Sharp sensor and accumulating inside. While a light vacuum can be used to remove large dust pieces which may be attached inside the sensor, your application design may preclude such kind of maintenance access to the sensor.
GP2Y1014AU0F connector cable
Sharp GP2Y1014AU0F uses the same type of 6-pin connector as the GP2Y1010AU0F model. Earlier iterations of the GP2Y1010AU0F sensor used the JST (Japan Solderless Terminal) connector S6B-ZR-SM4A. But all newer production versions of both sensors now use JCTC connector 11501W90-6P-S-HF which should be compatible with the old JST connector. What this all means is if you have an old cable harness for GP2Y1010AU0F, the cable should work just fine with GP2Y1014AU0F as well. The following table and figure shows the pin assignments for GP2Y1014AU0F.

Below is a picture of GP2Y1014AU0F with its connector cable attached.

Using GP2Y1014AU0F with Arduino
LED Pulse Drive Circuit
The specification for GP2Y1014AU0F isn’t very clear about how to hook up the sensor. A better example can be found in the Application Note for the GP2Y1010AU0F model. Both GP2Y1010AU0F and GP2Y1014AU0F require the same circuit consisting of a resistor (150 ohms) and a capacitor (220 uF) designed to pulse the sensor LED on and off instead of running it continuously. The LED degrades in intensity over time and pulsing the LED helps to extend its lifetime. The figure below from Sharp’s application note (section 6-1) shows an example circuit.

The application note further indicates (see below figure) that the LED should be pulsed on once every 10ms, using a pulse duration or width of 0.32ms. Once the LED is turned on, the application note says to sample the resulting analog output voltage after 0.28ms (or 280 microseconds) have elapsed from the moment the LED is switched on.

Arduino Circuit
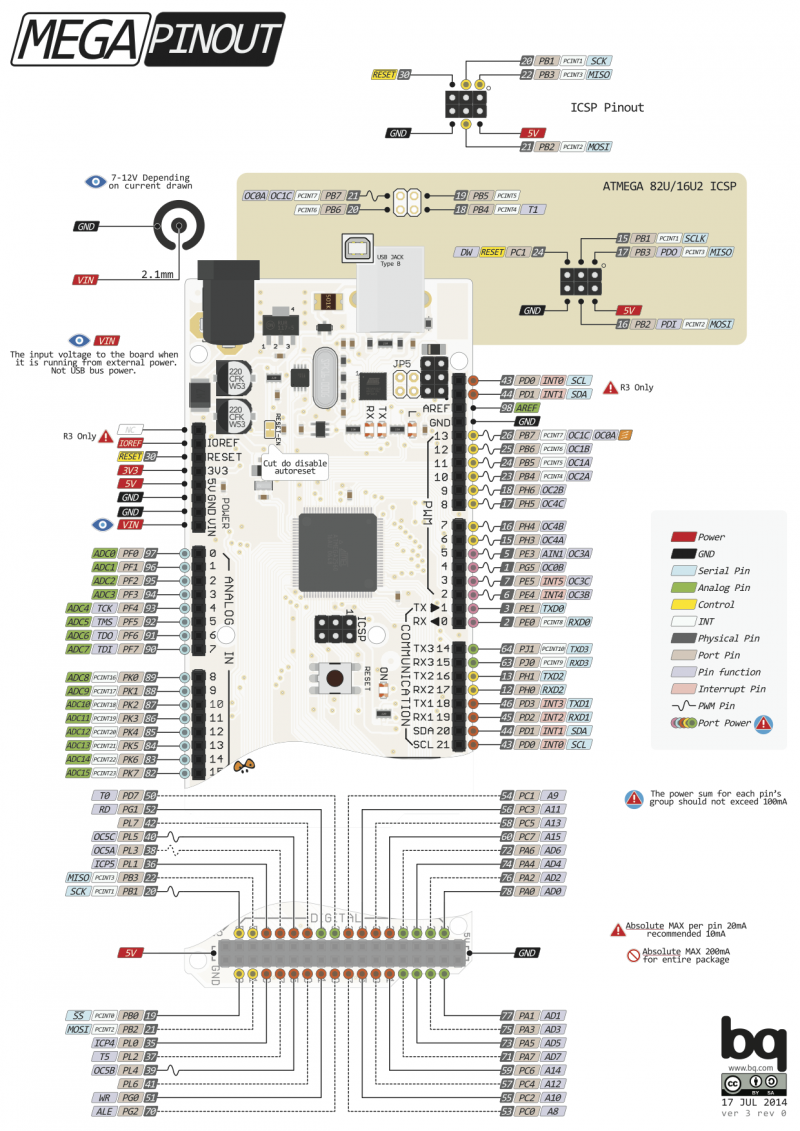
The following circuit is derived from the Application Note for the GP2Y1010AU0F model. This example uses Arduino Uno but it should work the same with Arduino Mega 2560.

The key connections to note are:
- The dust sensor LED terminal is connected to Arduino digital pin 7 which will be used to pulse the sensor LED on or off.
- The dust sensor Vo terminal is connected to Arduino analog input pin A5 which will be used to read the output voltage from the sensor.
Arduino Sketch (demo source code)
The demo source code shows how to:
- Turn the dust sensor LED on.
- Sample the analog output voltage after 0.28 milliseconds have elapsed. This gives a value from 0 to 1023. Based on the documentation for the Arduino analogRead function, this operation takes around 100 microseconds or 0.1 milliseconds to complete. This means that the pulse width generated by this demo program is at least 0.38 milliseconds which exceeds the pulse width recommended in the specification of 0.32 ms.
- Turn the dust sensor LED off.
- Compute an average voltage reading based on the last 100 samples. Using averaging gives more stable results but note that this is just a simple average that is computed every time 100 samples have been read. Since the LED pulse cycle is 10ms, this means an average voltage reading is generated about once per second.
- Convert the average voltage reading to a value in Volts.
- Dynamically adjust the Voc value (the output voltage under zero dust conditions). The Voc value is used for offset correction.
- Calibrate the voltage reading by applying offset correction and then calculating the dust density in units of ug/m3 using the formula below from Sharp.

You can adjust the Voc and K values in the source code so that your results correlate better against more accurate reference equipment such as a TSI DustTrak II Monitor.
Example Serial Monitor output
If you are switching between different Arduino boards, make sure you go to the Tools menu and set Board and Port appropriately before compiling or uploading the code. The following screen capture shows example output from the GP2Y1014AU0F dust sensor as displayed on the Arduino Serial Monitor.

Appendix
Distinguishing between smoke and house dust
The following excerpt from the Application Note for GP2Y1010AU0F (version 2.0) shows how to distinguish between cigarette smoke and house dust particles. This also applies to GP2Y1014AU0F.

Sensor Calibration
The GP2Y1014AU0F sensor outputs a voltage reading which varies linearly with PM/dust density. It is necessary to apply a bit of calibration to convert these output voltages to the desired PM/dust density values in units of ug/m3. There are two aspects to this calibration as described below.
Offset Correction
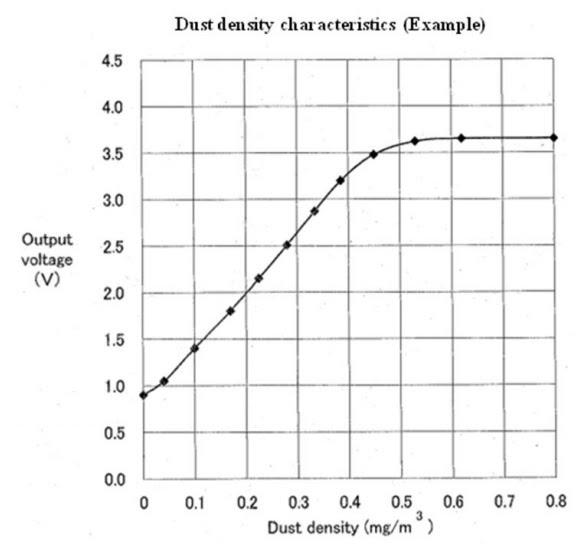
Even in a perfectly clean, zero dust environment, the GP2Y1014AU0F sensor will output a non-zero voltage value which is called Voc. This behavior is actually useful because you can easily tell whether the sensor is working or not. The GP2Y1014AU0F specification states that the typical value of Voc is 0.6 Volts. You can see this offset from a graph of Output voltage (V) versus Dust density (mg/m3) for this sensor (see Y-intercept).

Offset correction, therefore, involves determining this Voc value, and subtracting it from the uncorrected voltage reading from the sensor. However, determining Voc manually for every dust sensor on a production line may not be practical. The demo source code shows a simple solution to this problem by hardcoding the typical value of 0.6 Volts initially. Then during runtime, the Voc value is updated dynamically whenever a lower output voltage is sensed.
Scalar Coefficient
From the Output voltage versus Dust density graph, you can see that the response of the sensor is linear between roughly 0 ug/m3 and 500 ug/m3. By determining the slope of this graph, you get a scalar coefficient value which can be used to calculate dust density. In other words, the calibration steps are:
- Apply offset correction to the output voltage reading.
- Multiply the voltage by the scalar coefficient to get dust density.
The graph from the specification is just an example. Part of the calibration process then is to determine your own Output voltage versus Dust density graph by using a reference dust monitor. For example, choose a reference type of particulate matter to test, such as cigarette smoke, and then record two or more dust density readings reported by a highly accurate dust monitor such as a TSI DustTrak II Monitor. On a graph, plot the offset-corrected voltages from the Sharp sensor on the Y-axis against the dust density readings (in ug/m3) from the reference monitor on the X-axis. Two points are needed to determine the slope of the graph. If you have more than two points, you can use any number of online linear regression tools to calculate the line of best fit. The slope of the graph is the scalar coefficient for converting voltage to dust density.
Sharp’s documentation for the GP2Y1010AU0F dust sensor (which is very similar to GP2Y1014AU0F) goes a bit further and expresses the scalar coefficient in the form of a Sensitivity (K), in units of Volts/(100 ug/m3). The resulting dust density conversion/calibration formula from Sharp is as follows.

The demo source code uses a typical value for K of 0.5 Volts/(100 ug/m3). In practice, K should be adjusted according to the calibration procedure described above.
/////////////////////////////////////////////////////////////////////////////
// Sharp GP2Y1014AU0F Dust Sensor Demo
//
// Board Connection:
//   GP2Y1014    Arduino
//   V-LED       Between R1 and C1
//   LED-GND     C1 and GND
//   LED         Pin 7
//   S-GND       GND
//   Vo          A5
//   Vcc         5V
//
// Serial monitor setting:
//   9600 baud
/////////////////////////////////////////////////////////////////////////////

// Choose program options.
//#define PRINT_RAW_DATA
#define USE_AVG

// Arduino pin numbers.
const int sharpLEDPin = 7;   // Arduino digital pin 7 connect to sensor LED.
const int sharpVoPin = A5;   // Arduino analog pin 5 connect to sensor Vo.

// For averaging last N raw voltage readings.
#ifdef USE_AVG
#define N 100
static unsigned long VoRawTotal = 0;
static int VoRawCount = 0;
#endif // USE_AVG

// Set the typical output voltage in Volts when there is zero dust.
static float Voc = 0.6;

// Use the typical sensitivity in units of V per 100ug/m3.
const float K = 0.5;

/////////////////////////////////////////////////////////////////////////////

// Helper functions to print a data value to the serial monitor.
void printValue(String text, unsigned int value, bool isLast = false) {
  Serial.print(text);
  Serial.print("=");
  Serial.print(value);
  if (!isLast) {
    Serial.print(", ");
  }
}
void printFValue(String text, float value, String units, bool isLast = false) {
  Serial.print(text);
  Serial.print("=");
  Serial.print(value);
  Serial.print(units);
  if (!isLast) {
    Serial.print(", ");
  }
}

/////////////////////////////////////////////////////////////////////////////

// Arduino setup function.
void setup() {
  // Set LED pin for output.
  pinMode(sharpLEDPin, OUTPUT);

  // Start the hardware serial port for the serial monitor.
  Serial.begin(9600);

  // Wait two seconds for startup.
  delay(2000);
  Serial.println("");
  Serial.println("GP2Y1014AU0F Demo");
  Serial.println("=================");
}

// Arduino main loop.
void loop() {
  // Turn on the dust sensor LED by setting digital pin LOW.
  digitalWrite(sharpLEDPin, LOW);

  // Wait 0.28ms before taking a reading of the output voltage as per spec.
  delayMicroseconds(280);

  // Record the output voltage. This operation takes around 100 microseconds.
  int VoRaw = analogRead(sharpVoPin);

  // Turn the dust sensor LED off by setting digital pin HIGH.
  digitalWrite(sharpLEDPin, HIGH);

  // Wait for remainder of the 10ms cycle = 10000 - 280 - 100 microseconds.
  delayMicroseconds(9620);

  // Print raw voltage value (number from 0 to 1023).
  #ifdef PRINT_RAW_DATA
  printValue("VoRaw", VoRaw, true);
  Serial.println("");
  #endif // PRINT_RAW_DATA

  // Use averaging if needed.
  float Vo = VoRaw;
  #ifdef USE_AVG
  VoRawTotal += VoRaw;
  VoRawCount++;
  if ( VoRawCount >= N ) {
    Vo = 1.0 * VoRawTotal / N;
    VoRawCount = 0;
    VoRawTotal = 0;
  } else {
    return;
  }
  #endif // USE_AVG

  // Compute the output voltage in Volts.
  Vo = Vo / 1024.0 * 5.0;
  printFValue("Vo", Vo*1000.0, "mV");

  // Convert to Dust Density in units of ug/m3.
  float dV = Vo - Voc;
  if ( dV < 0 ) {
    dV = 0;
    Voc = Vo;
  }
  float dustDensity = dV / K * 100.0;
  printFValue("DustDensity", dustDensity, "ug/m3", true);
  Serial.println("");

} // END PROGRAM
ดัชนีคุณภาพอากาศ
ดัชนีคุณภาพอากาศ (Air Quality Index : AQI) เป็นการรายงานข้อมูลคุณภาพอากาศในรูปแบบที่ง่ายต่อความเข้าใจของประชาชนทั่วไป เพื่อเผยแพร่ประชาสัมพันธ์ให้ประชาชนได้ทราบถึงสถานการณ์มลพิษทางอากาศในแต่ละพื้นที่ รวมถึงผลกระทบจากมลพิษทางอากาศต่อสุขภาพ ซึ่งดัชนีคุณภาพอากาศ 1 ค่า ใช้เป็นตัวแทนค่าความเข้มข้นของสารมลพิษทางอากาศ 6 ชนิด ได้แก่
- ฝุ่นละอองขนาดไม่เกิน 2.5 ไมครอน (PM2.5) เป็นฝุ่นที่มีเส้นผ่านศูนย์กลางไม่เกิน 2.5 ไมครอน เกิดจากการเผาไหม้เชื้อเพลิงของยานพาหนะ การเผาวัสดุการเกษตร ไฟป่า และกระบวนการอุตสาหกรรม และเนื่องจากฝุ่นมีขนาดเล็กจึงง่ายต่อการแพร่กระจายสู่ถุงลมปอด ส่งผลให้เกิดโรคระบบทางเดินหายใจ และโรคปอดต่าง ๆ ซึ่งหากได้รับในปริมาณมากหรือเป็นระยะเวลานาน จะทำให้เกิดการสะสมในเนื้อเยื่อปอด ประสิทธิภาพการทำงานของปอดลดลง เกิดหลอดลมอักเสบและมีอาการหอบหืด
- ฝุ่นละอองขนาดไม่เกิน 10 ไมครอน (PM10) เป็นฝุ่นที่มีขนาดเส้นผ่านศูนย์กลางไม่เกิน 10 ไมครอน เกิดจากการเผาไหม้เชื้อเพลิง การเผาในที่โล่ง กระบวนการอุตสาหกรรม การบด การโม่ หรือฝุ่นผงจากการก่อสร้าง หากหายใจนำฝุ่นเข้าสู่ร่างกายจะเกิดการสะสมในระบบทางเดินหายใจ ส่งผลเสียต่อสุขภาพ
- ก๊าซโอโซน (O3) เป็นสารมลพิษทางอากาศในชั้นบรรยากาศผิวโลก เกิดจากปฏิกิริยาระหว่างก๊าซออกไซด์ของไนโตรเจน และสารประกอบอินทรีย์ระเหยง่าย โดยมีแสงแดดเป็นตัวเร่งปฏิกิริยา มีผลกระทบต่อสุขภาพ โดยก่อให้เกิดการระคายเคืองตาและระคายเคืองต่อระบบทางเดินหายใจและเยื่อบุต่างๆ ทำให้การทำงานของปอดลดลง เหนื่อยเร็ว โดยเฉพาะในเด็ก คนชรา และคนที่เป็นโรคปอดเรื้อรัง
- ก๊าซคาร์บอนมอนอกไซด์ (CO) เป็นก๊าซที่เกิดจากการเผาไหม้ไม่สมบูรณ์ของเชื้อเพลิงที่มีคาร์บอนเป็นองค์ประกอบ สามารถสะสมอยู่ในร่างกายโดยการรวมตัวกับฮีโมโกลบินในเม็ดเลือดแดง ซึ่งหากหายใจนำก๊าซชนิดนี้ในร่างกาย ก๊าซคาร์บอนมอนอกไซด์จะทำปฏิกิริยากับฮีโมโกลบินในเลือด เกิดเป็นคาร์บอกซีฮีโมโกลบิน (CoHb) ทำให้การลำเลียงออกซิเจนไปสู่เซลล์ต่างๆ ของร่างกายลดน้อยลง ส่งผลให้ร่างกายเกิดอาการอ่อนเพลีย และหัวใจทำงานหนักขึ้น
- ก๊าซไนโตรเจนไดออกไซด์ (NO2) เป็นก๊าซที่มีอยู่ทั่วไปในธรรมชาติ หรือเกิดจากการกระทำของมนุษย์ เช่น การเผาไหม้เชื้อเพลิงต่างๆ อุตสาหกรรมบางชนิด เป็นต้น ก๊าซนี้มีผลต่อระบบการมองเห็นและผู้ที่มีอาการหอบหืดหรือ โรคเกี่ยวกับทางเดินหายใจ
- ก๊าซซัลเฟอร์ไดออกไซด์ (SO2) เป็นก๊าซที่เกิดจากธรรมชาติและการเผาไหม้เชื้อเพลิงที่มีกำมะถัน (ซัลเฟอร์) เป็นส่วนประกอบ สามารถรวมตัวกับสารมลพิษอื่นแล้วก่อตัวเป็นอนุภาคฝุ่นขนาดเล็ก ก๊าซนี้มีผลกระทบโดยตรงต่อสุขภาพ ทำให้เกิดการระคายเคืองต่อเยื่อบุตา ผิวหนัง และระบบทางเดินหายใจ หากได้รับเป็นเวลานาน ๆ จะทำให้เป็นโรคหลอดลมอักเสบเรื้อรังได้้
ดัชนีคุณภาพอากาศของประเทศไทย
ดัชนีคุณภาพอากาศของประเทศไทยแบ่งเป็น 5 ระดับ คือ ตั้งแต่ 0 ถึง 201 ขึ้นไป ซึ่งแต่ละระดับจะใช้สีเป็นสัญลักษณ์เปรียบเทียบระดับของผลกระทบต่อสุขภาพอนามัย ดังแสดงในตารางที่ 1
ตารางที่ 1 เกณฑ์ของดัชนีคุณภาพอากาศตามมาตรฐานของประเทศไทย (TH AQI)
| สัญลักษณ์ | AQI | PM2.5 เฉลี่ย 24 ชั่วโมงต่อเนื่อง (μg/m3) | PM10 เฉลี่ย 24 ชั่วโมงต่อเนื่อง (μg/m3) | ความหมาย | แนวทางการป้องกัน |
|---|---|---|---|---|---|
| 0-25 | 0-15.0 | 0-50 | คุณภาพอากาศดีมาก | คุณภาพอากาศดีมาก เหมาะสำหรับกิจกรรมกลางแจ้งและการท่องเที่ยว | |
| 26-50 | 15.1-25.0 | 51-80 | คุณภาพอากาศดี | คุณภาพอากาศดี สามารถทำกิจกรรมกลางแจ้งและท่องเที่ยวได้ตามปกติ | |
| 51-100 | 25.1-37.5 | 81-120 | คุณภาพอากาศปานกลาง | [ประชาชนทั่วไป] สามารถทำกิจกรรมกลางแจ้งได้ตามปกติ [ประชาชนในกลุ่มเสี่ยง] หากมีอาการเบื้องต้น เช่น ไอ หายใจลำบาก ระคายเคือง ตา ควรลดระยะเวลาการทำกิจกรรมกลางแจ้ง | |
| 101-200 | 37.6-75.0 | 121-180 | คุณภาพอากาศมีผลกระทบต่อสุขภาพ | [ประชาชนทั่วไป] ควรเฝ้าระวังสุขภาพ ถ้ามีอาการเบื้องต้น เช่น ไอ หายใจลาบาก ระคาย เคืองตา ควรลดระยะเวลาการทำกิจกรรมกลางแจ้ง หรือใช้อุปกรณ์ป้องกันตนเองหากมีความจำเป็น [ประชาชนในกลุ่มเสี่ยง] ควรลดระยะเวลาการทากิจกรรมกลางแจ้ง หรือใช้อุปกรณ์ ป้องกันตนเองหากมีความจำเป็น ถ้ามีอาการทางสุขภาพ เช่น ไอ หายใจลำบาก ตา อักเสบ แน่นหน้าอก ปวดศีรษะ หัวใจเต้นไม่เป็นปกติ คลื่นไส้ อ่อนเพลีย ควรพบแพทย์ | |
| >200 | >75.1 | >180 | คุณภาพอากาศมีผลกระทบต่อสุขภาพมาก | ประชาชนทุกคนควรหลีกเลี่ยงกิจกรรมกลางแจ้ง หลีกเลี่ยงพื้นที่ที่มีมลพิษทางอากาศสูง หรือใช้อุปกรณ์ป้องกันตนเองหากมีความจำเป็น หากมีอาการทางสุขภาพควรพบแพทย์ |
ตารางที่ 2 ค่าความเข้มข้นของสารมลพิษทางอากาศที่เทียบเท่ากับค่าดัชนีคุณภาพอากาศของไทย
| ดัชนีคุณภาพอากาศ | PM2.5 (μg/m3) | PM10 (μg/m3) | O3 (ppb) | CO (ppm) | NO2 (ppb) | SO2 (ppb) |
| เฉลี่ย 24 ชั่วโมงต่อเนื่อง | เฉลี่ย 8 ชั่วโมงต่อเนื่อง | เฉลี่ย 1 ชั่วโมง | ||||
| 0-25 | 0-15.0 | 0-50 | 0-35 | 0-4.4 | 0-60 | 0-100 |
| 26-50 | 15.1-25.0 | 51-80 | 36-50 | 4.5-6.4 | 61-106 | 101-200 |
| 51-100 | 25.1-37.5 | 81-120 | 51-70 | 6.5-9.0 | 107-170 | 201-300 |
| 101-200 | 37.6-75.0 | 121-180 | 71-120 | 9.1-30.0 | 171-340 | 301-400 |
| 200 ขึ้นไป | 75.1 ขึ้นไป | 181 ขึ้นไป | 121 ขึ้นไป | 30.1 ขึ้นไป | 341 ขึ้นไป | 401 ขึ้นไป |
ช่วงเวลาเฉลี่ย และหน่วยสารมลพิษทางอากาศที่ใช้ในการคำนวน
PM2.5 เฉลี่ย 24 ชั่วโมงต่อเนื่อง: ไมโครกรัมต่อลูกบาศก์เมตร หรือ µg/m3
PM10 เฉลี่ย 24 ชั่วโมงต่อเนื่อง: ไมโครกรัมต่อลูกบาศก์เมตร หรือ µg/m3
O3 เฉลี่ย 8 ชั่วโมงต่อเนื่อง: ส่วนในพันล้านส่วน หรือ ppb หรือ 1/1,000,000,000
CO เฉลี่ย 8 ชั่วโมงต่อเนื่อง: ส่วนในล้านส่วน หรือ ppm หรือ 1/1,000,000
NO2 เฉลี่ย 1 ชั่วโมง: ส่วนในพันล้านส่วน หรือ ppb หรือ 1/1,000,000,000
SO2 เฉลี่ย 1 ชั่วโมง: ส่วนในพันล้านส่วน หรือ ppb หรือ 1/1,000,000,000
ดัชนีคุณภาพอากาศตามมาตรฐานของ US-EPA 2016 standard (US AQI)
ดัชนีคุณภาพอากาศตามมาตรฐานของ US-EPA 2016 แบ่งเป็น 6 ระดับ คือ ตั้งแต่ 0 ถึง 501 ขึ้นไป ซึ่งแต่ละระดับจะใช้สีเป็นสัญลักษณ์เปรียบเทียบระดับของผลกระทบต่อสุขภาพอนามัย ดังแสดงในตารางที่ 3
ตารางที่ 3 เกณฑ์ของดัชนีคุณภาพอากาศของ US-EPA 2016
| สัญลักษณ์ | AQI | PM2.5 เฉลี่ย 24 ชั่วโมงต่อเนื่อง (μg/m3) | PM10 เฉลี่ย 24 ชั่วโมงต่อเนื่อง (μg/m3) | ความหมาย | แนวทางการป้องกัน |
|---|---|---|---|---|---|
| 0-50 | 0-12 | 0-54 | คุณภาพอากาศดี | ประชาชนสามารถดำเนินกิจกรรมต่างๆ ได้ตามปกติ | |
| 51-100 | 13-35 | 55-154 | คุณภาพอากาศปานกลาง | [ประชาชนทั่วไป] สามารถทำกิจกรรมกลางแจ้งได้ตามปกติ [ประชาชนในกลุ่มเสี่ยง] ควรลดการออกแรงหนักหรือเป็นเวลานาน และสังเกตอาการไอและเหนื่อยของตัวเอง | |
| 101-150 | 36-55 | 155-254 | คุณภาพอากาศไม่ดีต่อกลุ่มเสี่ยง | [ประชาชนทั่วไป] สามารถทำกิจกรรมกลางแจ้งได้ตามปกติ [ประชาชนในกลุ่มเสี่ยง] ควรลดกิจกรรมนอกอาคารที่ใช้แรงหนักหรือเป็นเวลานาน โดยอาจพักเป็นระยะๆ หมั่นสังเกตอาการไอ ล้า ใจสั่น และแน่นหน้าอกของตนเอง หากมีโรคประจำตัวให้ปฏิบัติตามที่แพทย์แนะนำ | |
| 151-200 | 56-150 | 255-354 | คุณภาพอากาศไม่ดี | [ประชาชนทั่วไป] ควรลดกิจกรรมนอกอาคารที่ใช้แรงงานหนักหรือเป็นเวลานาน อาจพักเป็นระยะๆ [ประชาชนในกลุ่มเสี่ยง] ควรลดกิจกรรมนอกอาคารที่ใช้แรงงานหนักหรือเป็นเวลานาน ให้พักหรือทำงานในอาคาร | |
| 201-300 | 151-250 | 355-424 | คุณภาพอากาศไม่ดีอย่างยิ่ง | [ประชาชนทั่วไป] ควรหลีกเลี่ยงกิจกรรมนอกอาคารที่ใช้แรงหนักหรือเป็นเวลานาน หรือทำกิจกรรมในอาคารแทน [ประชาชนในกลุ่มเสี่ยง] ควรงดกิจกรรมนอกอาคารทุกชนิด ทำกิจกรรมในอาคารแทน | |
| 301-500 | 254-500 | 425-604 | คุณภาพอากาศอันตราย | [ประชาชนทั่วไป] ควรงดกิจกรรมนอกอาคารทุกชนิด [ประชาชนในกลุ่มเสี่ยง] ควรพักในอาคารเท่านั้น ทำกิจกรรมที่ไม่ออกแรงมาก |
ตารางที่ 4 ค่าความเข้มข้นของสารมลพิษทางอากาศที่เทียบเท่ากับค่าดัชนีคุณภาพอากาศของ US-EPA 2016
| AQI | PM2.5 (μg/m3) | PM10 (μg/m3) | O3 (ppb) | CO (ppm) | NO2 (ppb) | SO2 (ppb) |
| เฉลี่ย 24 ชั่วโมงต่อเนื่อง | เฉลี่ย 8 ชั่วโมงต่อเนื่อง | เฉลี่ย 1 ชั่วโมง | ||||
| 0-50 | 0-12 | 0-54 | 0-34 | 0-4.4 | 0-53 | 0-35 |
| 51-100 | 13-35 | 55-154 | 55-70 | 4.5-9.4 | 54-100 | 36-75 |
| 101-150 | 36-55 | 155-254 | 71-85 | 9.5-12.4 | 101-360 | 76-185 |
| 151-200 | 56-150 | 255-354 | 86-105 | 12.5-15.4 | 364-649 | 186-304 |
| 201-300 | 151-250 | 355-424 | 106-200 | 15.5-30.4 | 650-1249 | 305-604 |
| 301-500 | 251-500 | 425-604 | 30.5-50.4 | 1250-2049 | 605-1004 | |
การคำนวณดัชนีคุณภาพอากาศรายวันของสารมลพิษทางอากาศแต่ละประเภท
การคำนวณดัชนีคุณภาพอากาศรายวันของสารมลพิษทางอากาศแต่ละประเภท สามารถคำนวณได้จากความเข้มข้นของสารมลพิษทางอากาศจากข้อมูลผลการตรวจวัดคุณภาพอากาศ ซึ่งสามารถคำนวณดัชนีคุณภาพภายในช่วงระดับเป็นสมการเส้นตรง ดังนี้

| โดยที่ | I | คือ ดัชนีย่อยคุณภาพอากาศ |
| X | คือ ความเข้มข้นของสารมลพิษทางอากาศจากการตรวจวัด | |
| Xi | คือ ค่าต่ำสุดของช่วงความเข้มข้นสารมลพิษที่มีค่า X | |
| Xj | คือ ค่าสูงสุดของช่วงความเข้มข้นสารมลพิษที่มีค่า X | |
| Ii | คือ ค่าต่ำสุดของช่วงดัชนีคุณภาพอากาศที่ตรงกับช่วงความเข้มข้น X | |
| Ij | คือ ค่าสูงสุดของช่วงดัชนีคุณภาพอากาศที่ตรงกับช่วงความเข้มข้น X |
แหล่งที่มาของข้อมูล
กองจัดการคุณภาพอากาศและเสียง กรมควบคุมมลพิษ. ข้อมูลดัชนีคุณภาพอากาศ [ออนไลน์]. เข้าถึงได้จาก: http://air4thai.pcd.go.th/webV2/aqi_info.php (วันที่สืบค้น 15 มิถุนายน 2564)
ศูนย์ข้อมูลการเปลี่ยนแปลงสภาพภูมิอากาศ มหาวิทยาลัยเชียงใหม่. คำนวณค่า AQI [ออนไลน์]. เข้าถึงได้จาก: https://www.cmuccdc.org/calculate#USAQI (วันที่สืบค้น 15 มิถุนายน 2564)
Wikipedia. Air quality index [Online]. Available from: https://en.m.wikipedia.org/wiki/Air_quality_index?fbclid=IwAR2LMteREhN8ZzfJRHigU4oGCEOcsZL_gCNiV9yzkgzz0ZjDahkXAcSquM4 (15 June 2021))
Sharp’s GP2Y1010AU0F is an optical air quality sensor it is designed to sense dust particles. An infrared emitting diode and a phototransistor are diagonally arranged into this device, to allow it to detect the reflected light of dust in air. It is especially effective in detecting very fine particles like cigarette smoke, and is commonly used in air purifier systems.
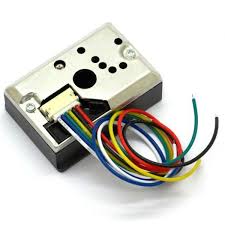
To interface with this sensor, you need to connect to its 6-pin, 1.5mm pitch connector by using mating connector.
Specifications:
- Low Current Consumption (MAX: 20mA)
- Typical Operating Voltage: 4.5V to 5.5V (MAX: 7V)
- The presence of dust can be detected by the photometry of only one pulse
- Enable to distinguish smoke from house dust
- Dimensions: 1.81 x 1.18 x 0.69” (46.0 x 30.0 x 17.6mm)
Connection
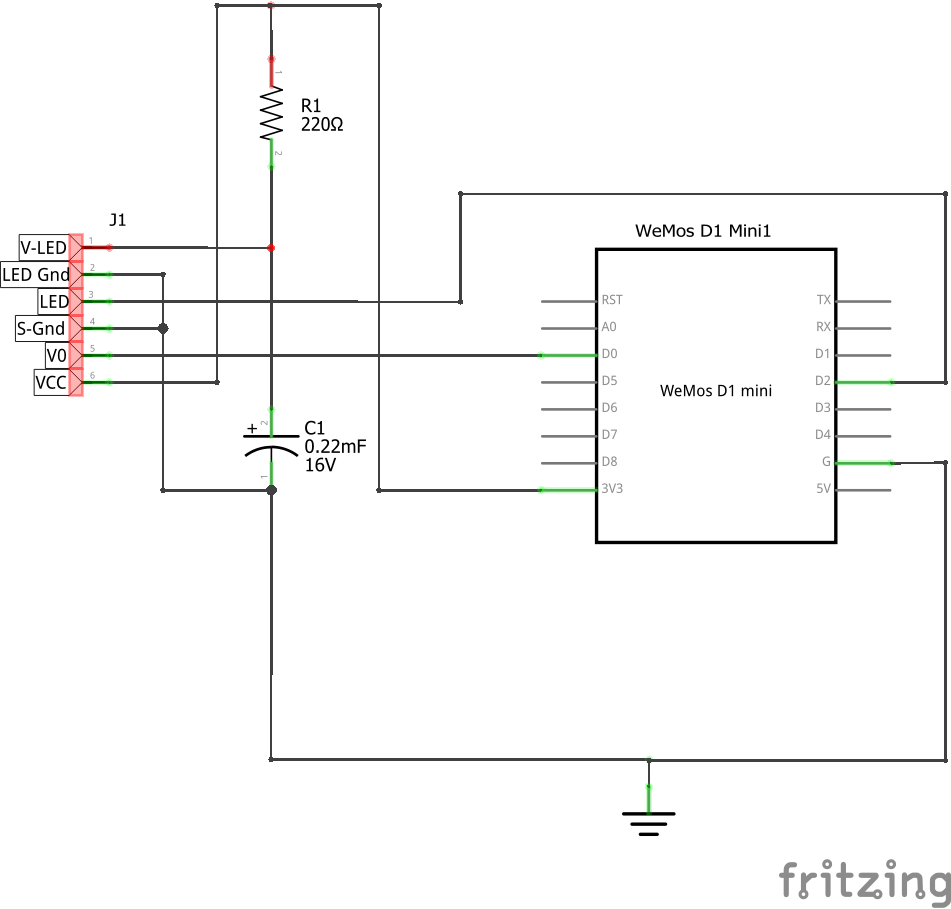
The following connections are used
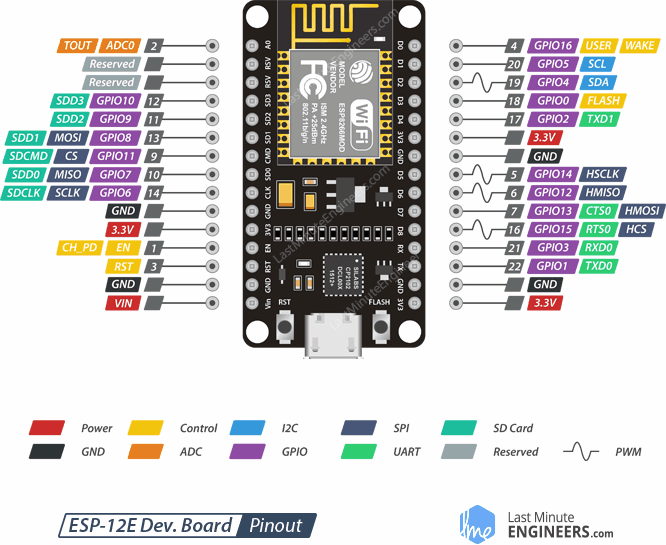
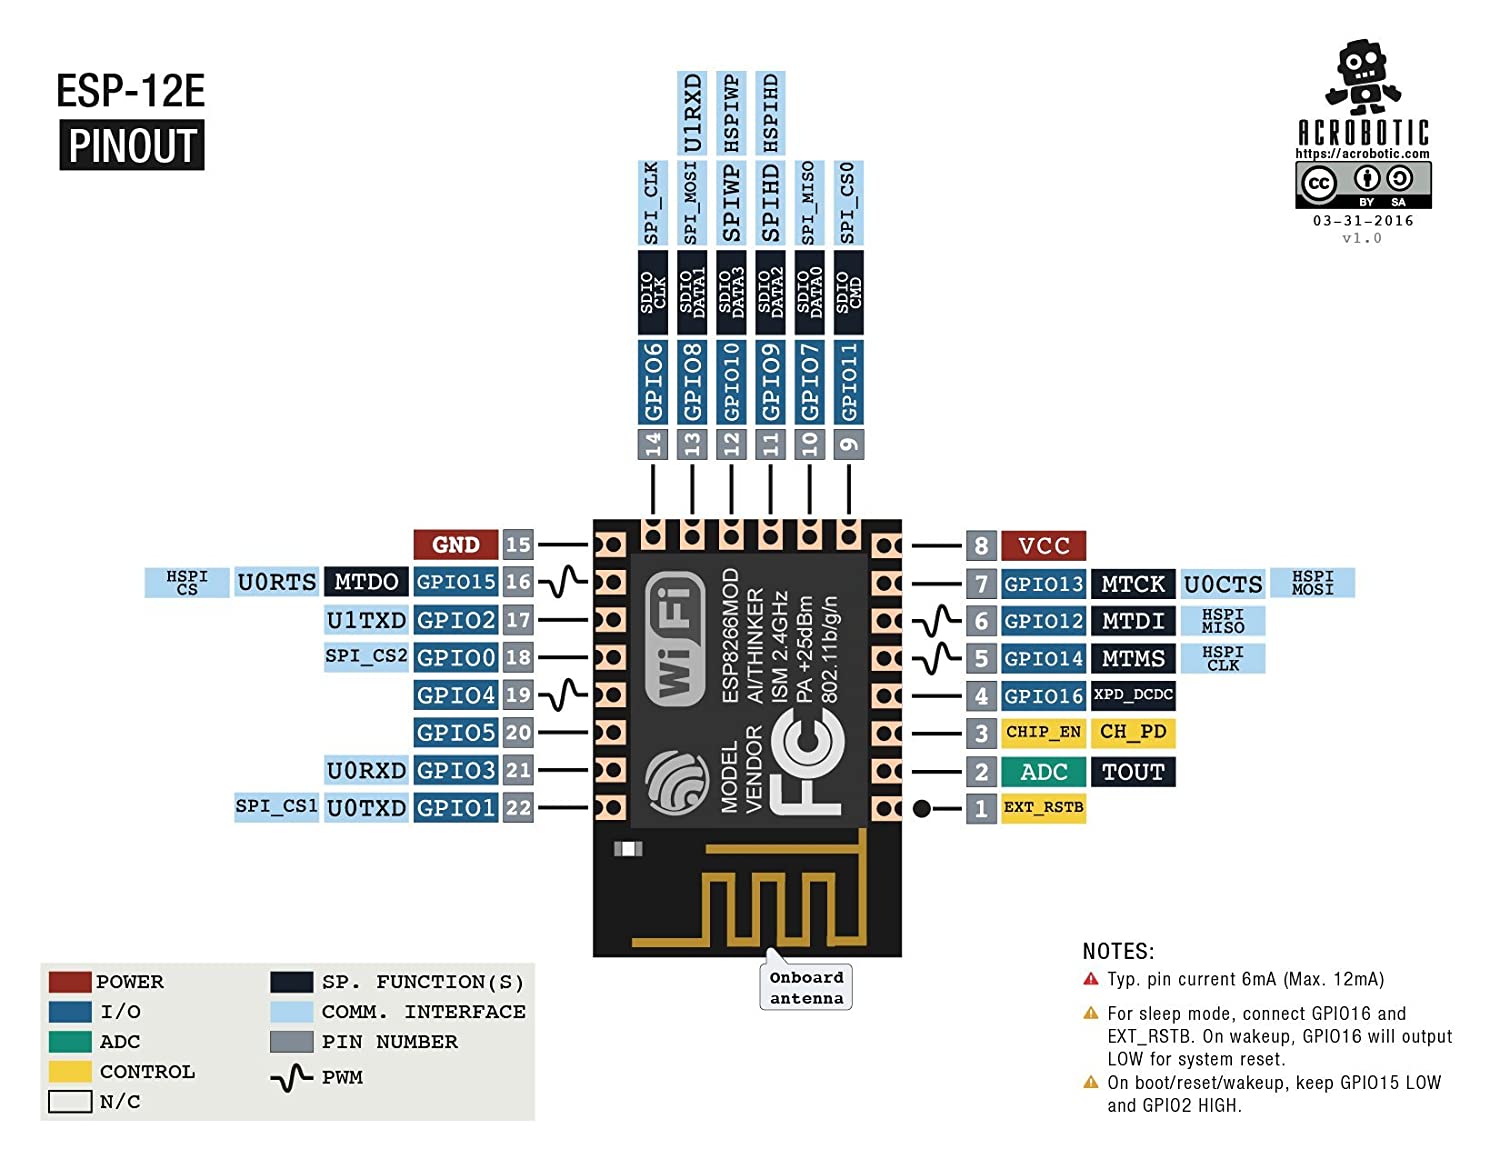
Sharp pin 1 (V-LED) = 3.3V this is connected via a 150 ohm resistor
Sharp pin 2 (LED-GND) = Wemos GND pin
Sharp pin 3 (LED) = Wemos pin D2
Sharp pin 4 (S-GND) = Wemos GND pin
Sharp pin 5 (Vo) = Wemos A0 pin
Sharp pin 6 (Vcc) = Wemos 3.3V
Refer to this layout diagram
Layout
Resister, R1=150Ω and capacitor, C1=220uF mentioned above is required for pulse drive of the LED of GP2Y1010AU0F. Please use the ones with the above mentioned constants. Without these components, the device does not work.
Code
int dustPin = A0; // dust sensor - Wemos A0 pin
int ledPin = D2;

float voltsMeasured = 0;
float calcVoltage = 0;
float dustDensity = 0;

void setup()
{
  Serial.begin(57600);
  pinMode(ledPin,OUTPUT);
}


void loop()
{
  digitalWrite(ledPin,LOW); // power on the LED
  delayMicroseconds(280);

  voltsMeasured = analogRead(dustPin); // read the dust value

  delayMicroseconds(40);
  digitalWrite(ledPin,HIGH); // turn the LED off
  delayMicroseconds(9680);

  //measure your 5v and change below
  calcVoltage = voltsMeasured * (3.3 / 1024.0);
  dustDensity = 0.17 * calcVoltage - 0.1;
  Serial.println("GP2Y1010AU0F readings");
  Serial.print("Raw Signal Value = ");
  Serial.println(voltsMeasured);
  Serial.print("Voltage = ");
  Serial.println(calcVoltage);
  Serial.print("Dust Density = ");
  Serial.println(dustDensity); // mg/m3
  Serial.println("");
  delay(1000);
}
Testing
This is the output that I saw via the serial monitor
GP2Y1010AU0F readings
Raw Signal Value = 6.00
Voltage = 0.03
Dust Density = -0.10
Datasheet – http://www.sharp-world.com/products/device/lineup/data/pdf/datasheet/gp2y1010au_appl_e.pdf
GP2Y1010AU0F Compact Optical Dust Sensor Smoke Particle Sensor With Cable
ดาวน์โหลด Library
Code: https://www.cybertice.com/
#include <SoftwareSerial.h>
SoftwareSerial mySerial(21,22); // RX, TX
unsigned int pm1 = 0;
unsigned int pm2_5 = 0;
unsigned int pm10 = 0;
void setup() {
Serial.begin(9600);
while (!Serial) ;
mySerial.begin(9600);
}

void loop() {
int index = 0;
char value;
char previousValue;

while (mySerial.available()) {
value = mySerial.read();
if ((index == 0 && value != 0x42) || (index == 1 && value != 0x4d)){
Serial.println("Cannot find the data header.");
break;
}

if (index == 4 || index == 6 || index == 8 || index == 10 || index == 12 || index == 14) {
previousValue = value;
}
else if (index == 5) {
pm1 = 256 * previousValue + value;
Serial.print("{ ");
Serial.print("\"pm1\": ");
Serial.print(pm1);
Serial.print(" ug/m3");
Serial.print(", ");
}
else if (index == 7) {
pm2_5 = 256 * previousValue + value;
Serial.print("\"pm2_5\": ");
Serial.print(pm2_5);
Serial.print(" ug/m3");
Serial.print(", ");
}
else if (index == 9) {
pm10 = 256 * previousValue + value;
Serial.print("\"pm10\": ");
Serial.print(pm10);
Serial.print(" ug/m3");
} else if (index > 15) {
break;
}
index++;
}
while(mySerial.available()) mySerial.read();
Serial.println(" }");
delay(1000);
}
Link:https://github.com/sharpsensoruser/sharp-sensor-demos, https://pm2_5.nrct.go.th/definition,https://circuitdigest.com/,https://www.esp8266learning.com/wemos-dust-sensor

